 By Professor Satya Narayan Misra in Bhubaneswar, February 16, 2026: The decision of the government to have a new Consumer Price Index from 1st January 2026 is both sensible and welcome. It shifts the earlier base year from 2011-12 to 2023-24, based on Household Consumption Expenditure Survey (HCES) conducted by NSSO in 2023-24.
The new CPI will reflect the changing contours of consumption in both Rural & Urban areas, and most importantly demonstrate how food and beverages constituted 46% of total consumption has now come down to 37% while non-food consumption has gone up by 5%. Accordingly, headline inflation will now be more impacted by core inflation rather than by volatile items like food and fuel.
Genesis of CPI as Policy Anchor for Inflation
It may be recalled that a professional Committee under Urjit Patel, then Deputy Governor had recommended in 2014 that the RBI should adapt the Consumer Price Index (CPI – Combined) as the measure of the anchor for policy communication instead of Wholesale Price as the WPI weights are primarily based on production and traded values and do not capture price movement in non-commodity producing sectors like services which constitute 6% of India’s economic activities. The CPI inflation closely reflects cost of living that consumers face in the retail market. The Committee observed that almost all Central banks in the Advanced Economies (AEs) and Emerging Market economies (EMEs) use CPI as their primary price indicator.
Factors Contributing to The New CPI
The Household Consumption Expenditure Survey of 2023-24 brings out sharp changes both in consumption of rural and urban sector and also in overall consumption matrix compared to its survey conducted in 2011-12. The number of items included has also gone up from 299 to 358. Taking note of the expanding panoply of the service sector; the number of items in the service sector has gone up from 40 to 50. It includes price of surging 12 online markets and OTT products. E commerce accounts for nearly 7% – 9% of retail sales and is expected to increase by 18% every year, to reach around 15%-17% by 2030. The new CPI excludes free food being provided to nearly 80 cr people under the NFS Act (2013), costing the exchequer nearly Rs 2.11 lakh Crores.
The Changed Consumption Matrix
The following chart brings out the changing matrix in consumption of food and non-food items in a decade’s time.
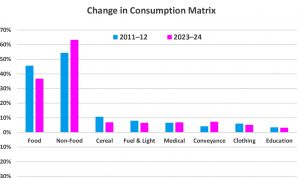
Some of the measure trends as seen from above are sharp decreases in Food items by 9%, particularly cereals by 4%. One of the contributing factors could be free food issued under the PDS, which has not been taken in to the new CPI series. It would be interesting to note that the weight of food which was 55% in Consumption Survey In 2004-05 , has progressively come down to 48% by 2011-12 to 37% in 2023-24 . This is a positive trend as consumption of non-food items and of services has significantly increased. A significant difference in weightage of rentals shows that in urban areas it is around 6.5% of total expenditure as against .55% in rural areas. Also % of expenditure in education in urban areas is far more at 6% compared to 3% in rural areas.
The Conundrum of Core Vs Food Vs Headline Inflation
The head line inflation is a composite of core and food inflation, which is volatile. The CEA Mr Nageswaran argues that the RBI should in future be guided by core inflation rather than headline inflation while Dr Pranob Sen, former Chief Statistician of India is not too sure. It would be interesting to see the trend of these three types of inflation, which can be a nightmare for any Monetary Policy Committee to decide on a suitable repo rate so that inflation remains reined in the range of 4+- 2%.
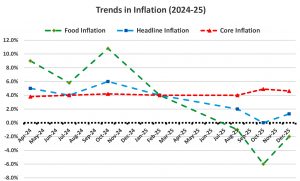
Source: RBI
It would be clearly see from the above that core inflation shows a stable trend of around 4% while food inflation can vary from -6% to 10.8% .Similarly, indices of energy also show a volatile character, based on exogenous factors. The contention of CEA that core inflation should guide decision on repo rate by the MPC makes eminent sense.
Implications for the Future
Quite the new series is very comprehensive and takes care of many items and factors that have been added to the consumption basket of consumers. The weightage of rural areas has come down from 58% to 55% , and that of Urban areas increased from 42 % to 45 %. The new CPI series will now be the guiding factor for the MPC Committee to determine future repo rates. After the reduction of repo rate to 5.25 % in December 2025 from a high of 6.5% during 2024-25, the MPC has now decided not to scale it down further. To be fair to the earlier RBI governor, the mercurial nature of food inflation had weighed on his mind rather heavily.
As Prof Galbraith had wittily observed, “The only job of economic forecasting is to make astrology look respectable.” The mandarins in the Mint Street are well aware of the pernicious effect of high food inflation on not only the economic climate but also the adverse political impact it can unleash. Interestingly, the CPI in January 2026, with the new CPI series has now zoomed up to 2.75% as against 1.3% in December 2025. This will possibly pre-empt any further decrease in repo rate, as the new series is like to add another 150 basic points to earlier headline inflation given the new configuration of consumption items and their relative weightage in total consumption.
The RBI will now tread with extreme caution, given the plateau of private sector investment around 24% for quite some time, lack of discernible growth in private final consumption and the uncertainty shrouding our trade environment, with India seemingly willing to buy costlier American oil in place of cheaper Russian oil. Strategic autonomy can be a slippery proposition when enfeebled by unreasonable global bullies like President Trump. In these turbulent times, the new CPI series lends a sliver of hope & a whiff of stability to measure inflation and provide a template for arriving at a robust repo rate by the RBI.

Leave a Reply
Be the First to Comment!