 Professor Satya Narayan Misra* in Bhubaneswar, July 20, 2025: The World Bank Report “Indian Poverty & Equity Brief: April 2025” claims that India has almost eradicated extreme poverty. People living on less than $2.15 per day has fallen from 16.2% in 2011-12 to 2.3% in 2022-23, with 171 million people escaping extreme poverty during a decade’s time.
Rural India, where 70% people live, extreme poverty has fallen from 18.2% in 2011-12 to 2.8% and while for Urban India the reduction is from 10.7% to 1.1%. This has narrowed down the Urban Rural Gap from 7.7% to 1.7%. The World Bank Report is based on HCES (Household Consumption Expenditure Survey) of 2022-23.
Even by the measure of Multi-Dimensional Poverty Index, used by SDG, the % people multi dimensionally poor has come own from 29% in 2013-14 to 11% by 2022-23, with 248 million escaping multi-dimensional poverty in terms of health, education and living standards.While poverty has certainly declined, there are certain disturbing trends, which seem to support the contention that the extent of fall is being overstated & we need to look beyond this hype.
The Problem Areas
There is a major change in methodology of data collection I 2011-12 as compared to 2022-23. The earlier consumption data was based on single visit covering both food and non-food items, while the data collected in the survey of 2022-23 is based on Modified Mixed reference period method by making multiple visits. While (MMRPM) is a more scientific method and globally used now, the the Marginal Propensity Consumption Expenditure (MPCE) figure of Rs 1430 in 2011-12 cannot be compared with MPCCE of Rs 4122 in 2022-23 in Rural India.
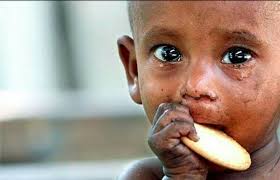
Besides, the consumption figures in 22-23 account for all free goods and services like food, free gas cylinders, cash transfers to women and farmers which were not earlier accounted for. These welfare transfers account for more than 8% of GDP.Besides as per Global Hunger Index report 2024India ranks 105 out f 127 countries, with 35.5% children under five being stunted, indicating chronic undernutrition and around 13.7% of population (200 million) undernourished, highlighting a serious food access issue. In terms of MDPI, deprivation % in case of cooking fuel is 26.7%, Housing deprivation of 23.6%, 26% in terms of education & 24.6% in terms of poor sanitation are particularly distressing. There is glaring difference between states, with states like Kerala having negligible MDPI (1.1%), as against 35.9% in Odisha & 21.3% in Gujarat.
Changing Composition of Consumption
A comparison of consumption of food and non-food consumption shows that both in rural areas and urban areas the share of food in the total consumption basket has decreased during 1999-2000 to 2023-24 as per the HCPE Survey. In particular, there is a drastic reduction in the share of consumption of cereals, while consumption of beverages and processed food has significantly increased. In the non-food category, the increases are seen in items like conveyance and durable goods. The following table sourced from HPCE 2023-24 will bring out the trends.
Trends of Consumption (Rural India) showing Share %
Nature of Consumption 1999-2000 2023-24
Food (share %) 59.4% 47%
Cereal 22.1 4.97
Beverage & Processed Food 4.1 9.8
Eggs, Fish & Mutton 3.3 4.9
Non Food (share %) 41.6% 53%
Conveyance 5.5 8.4
Durable Goods 3.6 6.8
The HCPE data show that the country’s consumption basket is healthier now than everbefore. Between 2012 and 2023, the per capita availability of milk and eggs has increased by 65% and 63% respectively. The availability of fruits, vegetables and protein products has also increased. As shown above, the share of cereals in the food bill has decreased while that of healthier products has increased for all strata of the society.
 Reduction in Consumption Inequality
The World Bank report brings out how during 2011-12 and 2022-23, India registered a major decline in consumption inequality. The GINI coefficient for consumption inequality has reduced from .283 in 2011-12 to .237 in 2023-24(19% reduction) for rural areas and from .363 in urban areas to .284 during the same period (28% reduction). The decrease in consumption inequality is substantial and indisputable. The dietary intake improvements are most striking for the bottom 20% of households in both rural and urban areas.
It is important to examine income inequality separately from consumption inequality. As per the World Inequality Lab report, the share of bottom 50% in total income in 1990 has reduced from 21 % to 13% in 2021 , while the share of top 10% has increased from 32% to 57% during the comparable period. The WIL uses the income tax data as per which top 1% account for 22.6% of total income while bottom50% account for 13%. The NCAER & PRICE survey based estimates that also cover the informal sector get the opposite results. As per them, the top 1% had 8.8% of total income and the while the bottom 50% had 22. 8% in 2022-23!
Policy Intervention
While the leading proponents like Piketty and Banerjee in the World Inequality Report strongly pitch for higher tax on the super-rich in the range of 40-50% and wealth tax of 5%, the NCAER survey implore upon the policy makers to shift focus from redistribution of income through higher taxes on the super-rich to empowerment. They bring out how top 20% save 68% of the total savings of the country, middle 60% 33%, the bottom 20% are perennially indebted.
Therefore, the policy intervention for top 20% would be howto encourage them to make more productive investments,for middle 60% to build assets and provide tax friendly tools .However for the bottom 20%, the thrust has to be quality education, job creation , skilling and formalization. The India employment Report (2024) shows how the average monthly wage of casuals (20% of work force) is as low as Rs 4712, while that of self-employed (58%) is Rs 6843. The main challenge is how to skill them, make capital and technology accessible from formal sources to the micro enterprises, so that there is substantial improvement in their income, consumption and saving levels.
 The hype of elimination in extreme poverty and reduction in consumption inequality mask the dismal employability and acutely low level of wage earning of bottom 20% of India’s population. The politics of poverty trumps economic logic, as around 200 million are below the extreme poverty line, while subsidized food is being distributed to around 715 people in India. The priority has to move away from freebies to garner vote to higher allocation to quality education, health care, sanitation and skilling, so that high growth walk hand in hand with capability development and real empowerment of the poor.
• Teaches in KIIT University, Bhubaneswar.

Leave a Reply
Be the First to Comment!